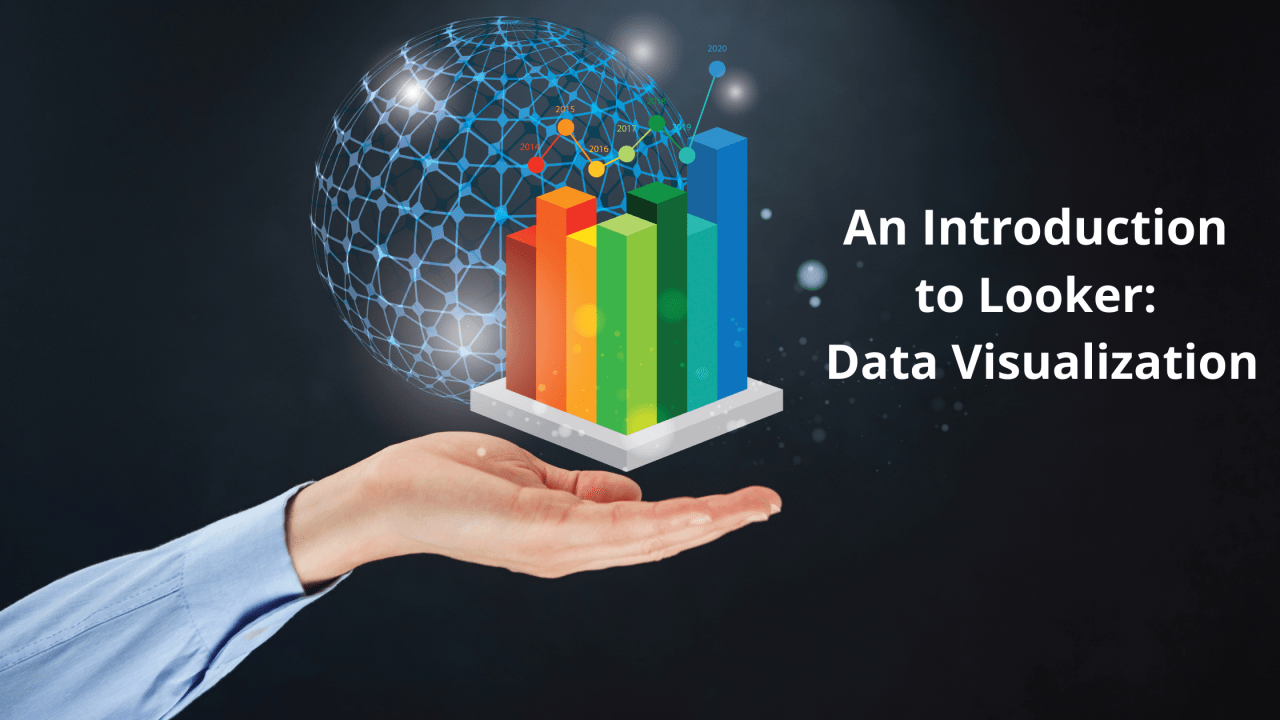

In the last two decades, we humans have become more immersed in data as our second nature, like watching a movie via a streaming service, shopping online, working out with a smartwatch, and posting our comments on social media platforms. However, the way we experienced these data evolved gradually over a period with the development of new technologies. Just like google transformed how we access worldwide information, Looker has transformed the way we experience data at work by using a unique approach to analyzing the data.
Our customers love Looker which is a browser-oriented analytics platform that converts GUI-based user input into SQL queries and relays it directly to the database in live mode. Its inbuilt visuals can explore, analyze and visualize the data in real-time. Also, works perfectly well with cloud environments such as google cloud, AWS, Azure, and Snowflake.
Key Features:
- Connecting your Data: It can seamlessly connect with your SQL database or data warehouse using a wide range of connectors given out of the box. A database connection is mandatory as it sends queries to the database in live mode.
- Modelling your Data: After connections are made and tested, we will need to add/select the tables in our database and define its relationship using its backend known as “LookML”. It provides a data modelling layer where you can define its relationships, add new variables, define drill-down features, and a lot more.
- Collaborating your Data: Multiple developers can work in parallel and fasten the development of an optimum data model that will act as a single source of truth for every type of users.
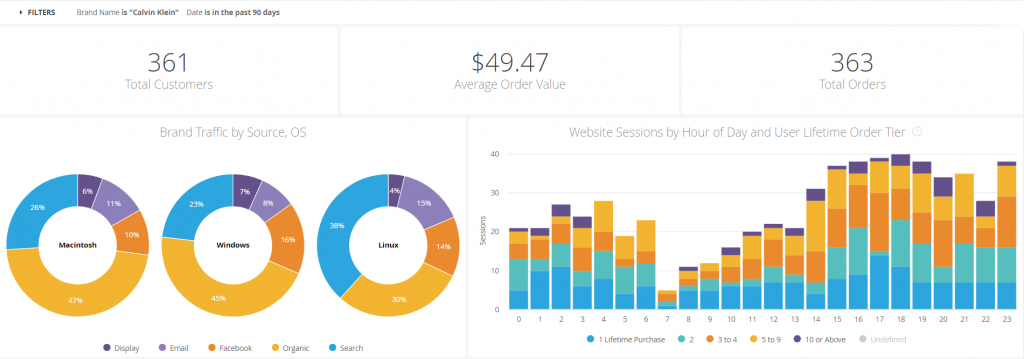
- Visualizing your data: Once the base LookML model is ready, multiple teams can generate various types of reports with a different visualization. The users can add tables, evolve and version the model as per their requirements. It’s usually done in two ways: Looks and Dashboards
- Looks are singular visualizations that can analyze data randomly, and share one-off insights with the required user or team.
- Dashboards allow multiple visualizations and KPI’s to be presented together which can be linked in multiple ways to extract insights, track performance, and support data-driven decisions.
Where Gizmeon can help you?
If your organization has lots of structured and semi-structured data, then we can help you in implementing Looker to get you real-time insights with speed and accuracy. Also, develop multiple dashboards for various teams as per the KPIs and metrics required by your organization.